
![5 Methods for Developing Problem-Solving Skills [Infographic] | Digital-News on Scoop.it today | Scoop.it](https://img.scoop.it/fRF6vtcuxFPgryx6EnVlsTl72eJkfbmt4t8yenImKBVvK0kTmF0xjctABnaLJIm9)
In Teaching Students to Dig Deeper: The Common Core in Action Ben Johnson identifies the skills and qualities that students need, based on the Common ...
Via Gust MEES, Ariana Amorim, David Schultz, Lynnette Van Dyke
Get Started for FREE
Sign up with Facebook Sign up with X
I don't have a Facebook or a X account


 Your new post is loading...
 Your new post is loading...
Your new post is loading...
In Teaching Students to Dig Deeper: The Common Core in Action Ben Johnson identifies the skills and qualities that students need, based on the Common ... Via Gust MEES, Ariana Amorim, David Schultz, Lynnette Van Dyke 
|

|
Rescooped by Thomas Faltin from Social media and Marketing Spyglass Measurement and Analytics |
![Why You Need to Build Your Brand Online [infographic] | Digital-News on Scoop.it today | Scoop.it](https://img.scoop.it/lnTzSJHISN3lgUBJZe22zjl72eJkfbmt4t8yenImKBVvK0kTmF0xjctABnaLJIm9)
The Internet offers so many more possibilities for small businesses than ever before. The online marketing opportunities are limitless, and it can be done with the social networks that you use everyday.
So, 'Why Build Your Brand Online?' The answer is simple, because that’s where everyone is. People are going to look for information about your business all hours of the day, everyday. Give your customers the opportunity to see your brand and message at all times. Let them develop a loyalty to your business via the Internet, and the increased opportunities for revenue rewards will likely soon follow.
By developing your brand online, you are able to use a vast array of measurement tools to get to know your audience. You can see what messages, and which types of media get the most responses from your customers, as well as, what times of the day get the most activity from your Facebook Fans and hits on your website. From these measurements, not only can you better brand your message based on your customers, but you can give them the voice to support your business to others. Tailoring your message to your customers is vital to building your online brand.
Learn more about online branding and more tips for business development through social media at the article link...
|
|
Rescooped by Thomas Faltin from Digital Marketing Fever |
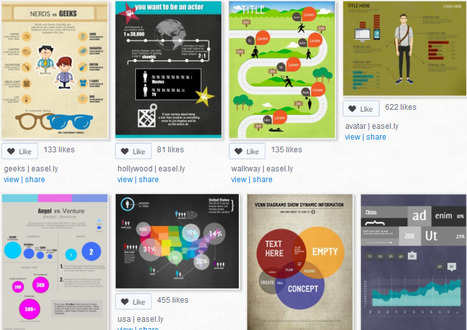
An easy way to create infographics and posters with ready-made visual themes.
Wow -- I see several templates I'm going to use today for my work with clients. What fun! This platform looks easy to use and I hope it is. Talk about some great visual storytelling!
In the meantime, I hope you find some templates you can use. Enjoy playing!
Thanks to fellow curator Baiba Svenca for finding this and sharing!
This review was written by Karen Dietz for her curated content on business storytelling at www.scoop.it/t/just-story-it ;


For more information on Online Solutions, please visit our website or contact us.

The current wave in marketing and/ or knowledge sharing.
|
|
Rescooped by Thomas Faltin from teaching with technology |
![Visual Information & How It Affects Website Traffic [Infographic] | Digital-News on Scoop.it today | Scoop.it](https://img.scoop.it/uw2LStByugjHwewG47Kdvjl72eJkfbmt4t8yenImKBVvK0kTmF0xjctABnaLJIm9)
Educate yourself about the importance of visual information on your website. With infographics, you will gain a lot more traffic for your growing website.
Visual information is processed faster by the brain, with 90% of all the information that we take in is visual. But the thing with visual information is also that unless it’s a really good story or article, people don’t want to read through a whole page of text when he or she could do something else more fun. So, throw in an infographic with visual information, and you’ll have a winner...
|
|
Rescooped by Thomas Faltin from Education & Numérique |

"The use of WhatsApp, WeChat, Line or SnapChat is booming all around the world. At KRDS, a leading Social Media Agency in Europe and Asia, we believe that in 2014, instant messaging apps will continue to soar. We also believe that they possess a huge marketing potential that brands targeting a young audience should definitely not neglect..."
|
|
Rescooped by Thomas Faltin from Curation Revolution |

Top 10 Scoops By Clicks
1. http://sco.lt/8Q8W6j Future of Markeing [Infographic]
2. http://sco.lt/68zYfp 21 Content Types We Crave
3. http://sco.lt/91MkRF SEO, LinkedIn & The Real You, How LinkedIn Is Crowdsoucing You
4. http://sco.lt/7A3OAT New SEO vs. Old SEO Smackdown [Infographic]
5. http://sco.lt/8PV9Np How and Why Google Killed Long Tail of Search [Infographic]
6. http://sco.lt/8Jcwq1 12 Scoop.it Experts Share Top Cureation Tips
7. http://sco.lt/6UD0W9 Why Content Gets Shared: Social Mentions Study
8. http://sco.lt/6a2WVF The Content Marketing Mix [Infographic]
9. http://sco.lt/88TIZd Six Ways To Expand Your Social Media Reach [Infographic]
10. http://sco.lt/8eorNx Storytelling Is The New SEO [Slideshare]
Wow, 5 Infographics contributing 52% of top 10 clicks, a study and a Slideshare. Will do views next and compare and contrast.

Another proof what we call 'time' isn't chronological but spatial, the leap change in short period.
|
|
Rescooped by Thomas Faltin from 21st Century Learning and Teaching |

G+ is catching up big time for many reasons. Among these reasons is the Hangout integration.
We just facilitated a remote 1.5 day leadership development session with Hangouts and it was fantastic.
Google is sticking to their strategy and their value is starting to win people over. I was never a fan and, through valuable features, I am changing my perspective on the suite of offerings.
This is a relevant infographic.
|
|
Rescooped by Thomas Faltin from teaching with technology |
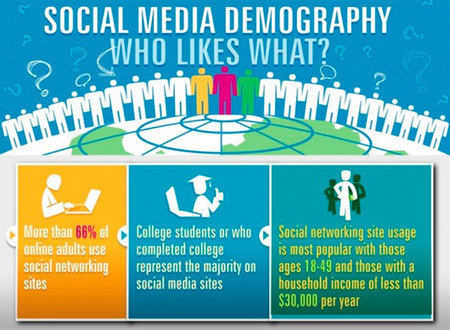
Being one of the most appealing and creative ways of representing data, an infographic gives viewers an opportunity to get acquainted with knowledge and make that information memorable and catchy. This can be especially helpful in visulizing statistics and more with regard to social media and online networking.
Visit the link for a collection of 30 informative and insightful social media infographics which tell a very interesting things about the communication tools we use everyday...
|
|
Rescooped by Thomas Faltin from Easy Ways To Get Your Own List |
An easy way to create infographics and posters with ready-made visual themes.
Wow -- I see several templates I'm going to use today for my work with clients. What fun! This platform looks easy to use and I hope it is. Talk about some great visual storytelling!
In the meantime, I hope you find some templates you can use. Enjoy playing!
Thanks to fellow curator Baiba Svenca for finding this and sharing!
This review was written by Karen Dietz for her curated content on business storytelling at www.scoop.it/t/just-story-it ;
For more information on Online Solutions, please visit our website or contact us.
The current wave in marketing and/ or knowledge sharing.
|
|
Rescooped by Thomas Faltin from Daily Magazine |


Let’s be honest, we don’t like to read big pieces of text. Text-heavy graphs are rather difficult for understanding, especially when dealing with numbers and statistics. That is why illustrations and flowcharts are often used for such kind of information.
An infographic, or a visual representation of study or data, like anything else, can be done right or wrong. How to create a successful infographic? A good idea and a good design.
Stop by the link for more on what defines an infographic, what contributes to its popularity, as well as the various types of infographics and references for tutorials and best practices.
Additional topics covered include:
The major parts of an infographic How to create an infographic Developing ideas & organizing data Research & sources Typography, graphics & color Facts & conclusions Designing & Editing
|
|
Rescooped by Thomas Faltin from Social Media and its influence |
![Twitter: A Day in the Life [INFOGRAPHIC] | Digital-News on Scoop.it today | Scoop.it](https://img.scoop.it/WZMc-sQaCuGsTXNpBMD_7zl72eJkfbmt4t8yenImKBVvK0kTmF0xjctABnaLJIm9)
This infographic reveals some surprising findings about what we share on Twitter -- and how we do it.


![20 Reasons Why you Should Use Google Plus [Infographic] | Digital-News on Scoop.it today | Scoop.it](https://img.scoop.it/j1fJ08aqSCOFcw0g2J6fxjl72eJkfbmt4t8yenImKBVvK0kTmF0xjctABnaLJIm9)


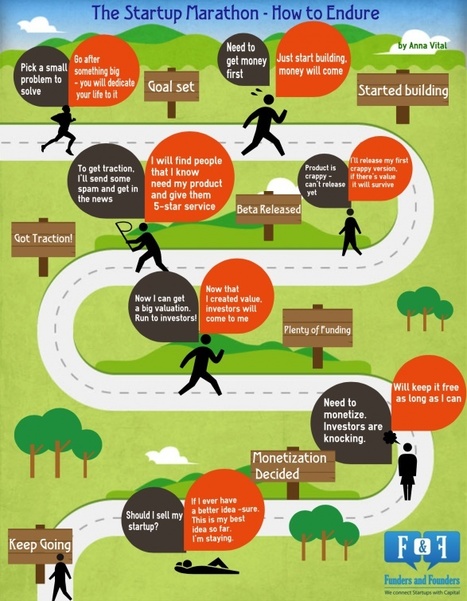
Interesting ways to incorporate the Common Core Concepts from Ben Johnson;s book Students to Dig Deeper...
Yes... creative problem solving can be learned/developed
A well-thought infographic