Digital-News on Scoop.it today
634.5K views | +133 today
Digital-News on Scoop.it today
Your new post is loading...
Rescooped by Thomas Faltin from Curation, Social Business and Beyond
Scoop.it!

How to Create Content that is Meaningful, Provocative and Keeps them Coming Back

How to Create Content that is Meaningful, Provocative and Keeps them Coming Back | Digital-News on Scoop.it today | Scoop.it
The Internet is full of people sharing interesting things all day. From liking pictures on Facebook to retweeting cool articles, sharing is something everyone enjoys doing in one way or another. Yet receiving likes and retweets can seem impossible.

Via janlgordon
janlgordon's comment, June 18, 2013 3:01 PM
Anastasia M. Ashman Great to see you, so sorry I'm late in responding, sooooooo busy, hope you're doing well!!
Pushpa Kunasegaran's curator insight, June 18, 2013 6:24 PM

So true!

María Dolores Díaz Noguera's curator insight, November 14, 2013 6:23 AM

Amazing

Rescooped by Thomas Faltin from Daily Magazine
Scoop.it!

All You Need to Know About Infographics: Tips, Tutorials, Guides

All You Need to Know About Infographics: Tips, Tutorials, Guides | Digital-News on Scoop.it today | Scoop.it

Let’s be honest, we don’t like to read big pieces of text. Text-heavy graphs are rather difficult for understanding, especially when dealing with numbers and statistics. That is why illustrations and flowcharts are often used for such kind of information.

An infographic, or a visual representation of study or data, like anything else, can be done right or wrong. How to create a successful infographic? A good idea and a good design.


Stop by the link for more on what defines an infographic, what contributes to its popularity, as well as the various types of infographics and references for tutorials and best practices.


Additional topics covered include:

The major parts of an infographic How to create an infographic Developing ideas & organizing data Research & sources Typography, graphics & color Facts & conclusions Designing & Editing


Via Lauren Moss, Monique Walhof, THE OFFICIAL ANDREASCY
HCL's curator insight, April 30, 2014 9:26 PM

Some good tips here...

Rescooped by Thomas Faltin from Content Marketing Tips
Scoop.it!

The Benefits of Content Curation and How to Make it Work for You

The Benefits of Content Curation and How to Make it Work for You | Digital-News on Scoop.it today | Scoop.it

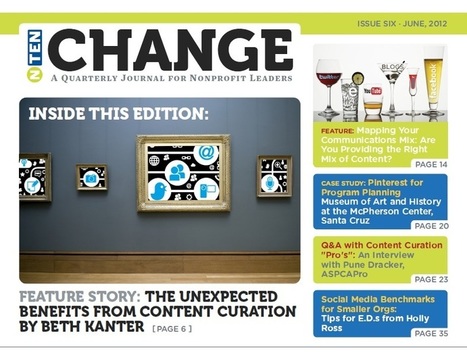
Beth Kanter wrote a very complete and interesting piece in NTEN's latest edition of their quarterly journal for non-profit leaders. You have to download the journal but it's worth it and it's free (you just need to register). 


Jan Gordon: I agree with Guillaume, Beth Kanter knows what she's talking about and her article is definitely worth reading.


Guillaume Decugis wrote this commentary:


"It's been fascinating for me to see how non-profits seem to embrace Social Media in general and Content Curation in particular - Beth of course being a key advocate in that move.


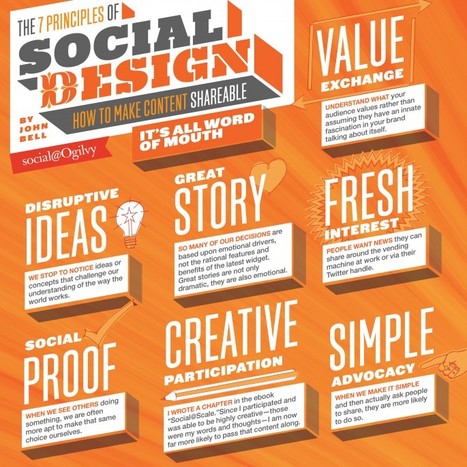
The broader take-away that I see for those of us in all sorts of organizations, as independant professionals or SMB-owners is the validation it brings to the model. When tightly-budgeted NPO's embrace a practice as a group, you can bet they're not wasting their scarce resources on a hype. They have to be efficient and as Beth puts it in the article: "Putting content curation into practice is part art form, part science, but mostly about daily practice. You don’t need to do it for hours, but 20 minutes every day will help you develop and hone the skills."


This is precisely where we see the opportunity with curation for professionals: building up a good practice that fits with one's daily routine and that -as Beth puts it - brings great "unexpected benefits".


Selected by gdecugis and Jan Gordon covering "Content Curation, Social Business and Beyond"


Read full article here: [http://tinyurl.com/75ucphe]


Via Guillaume Decugis, janlgordon, Tom George
Guillaume Decugis's comment, June 13, 2012 12:28 AM
You're welcome Beth. Thanks for the great piece!
Mshaber's comment, June 13, 2012 1:51 PM
Thanks...
janlgordon's comment, June 14, 2012 10:09 AM
Thank you Beth Kanter for the mention and for an amazing article, it's greatly appreciated!
Rescooped by Thomas Faltin from Daily Magazine
Scoop.it!

10 Ways You Will Convert More Customers With Easy To Apply Psychology [Infographic]

10 Ways You Will Convert More Customers With Easy To Apply Psychology [Infographic] | Digital-News on Scoop.it today | Scoop.it


Excerpted from article:


The “secret” to more sales is as simple as understanding just what your buyer wants (and expects) from your business.


We are all different, but in many instances our brains are prone to react in a similar manner.


Understanding these subtleties in the human mind can help your business find creative ways to ethically move more buyers towards saying “Yes!” to your products or services.


In this Infographic are 10 studies that reveal such insights into the minds of your customers.


1. Setting Minimums Helps Customers Break Through Action

2. Create Better Brand Engagement by Labeling Customers

3. Learn How to Sell to Your 3 Types of Buyers
4. Admit to Shortcomings in Order to Highlight Your Strengths
5. Implement Urgency… the Smart Way!
6. Appeal to the Need for Immediate Satisfaction
7. Don’t Be Afraid to Make an Enemy
8. Stand for Something that Customers Support
9. Create Persuasive Arguments by Playing Devil’s Advocate 

10. Keep Customers on Their Toes


Curated by Agostino Caniato:
http://bit.ly/Landing-Page-World


To deepen the points just mentioned read the full article here:http://bit.ly/UbnfAU

Marty Note [great tips and write up by Agostino. Kudos to @GregoryCiotti for some great conversion work. He has a free ebook on the link too. Going to download his book and report back.)


Via Agostino Caniato, SwipeZoom, Martin (Marty) Smith, THE OFFICIAL ANDREASCY
No comment yet.
Rescooped by Thomas Faltin from Cultivating Community
Scoop.it!

The top 20 data visualisation tools

The top 20 data visualisation tools | Digital-News on Scoop.it today | Scoop.it

From simple charts to complex maps and infographics, Brian Suda's round-up of the best – and mostly free – tools has everything you need to bring your data to life...

A common question is how to get started with data visualisations. Beyond following blogs, you need to practice – and to practice, you need to understand the tools available. In this article, get introduced to 20 different tools for creating visualisations...


Via Lauren Moss, Baiba Svenca, eRelations, zapleahy
Randy Rebman's curator insight, January 28, 2013 12:33 PM

This looks like it might be a good source for integrating infographics into the classroom.