Create, Innovate & Evaluate in Higher Education
29.4K views | +0 today
Follow
Create, Innovate & Evaluate in Higher Education
All about Educational Innovation, new tools & trends, MOOCs in Higher Education
Curated by Alfredo Corell
Your new post is loading...
Scooped by Alfredo Corell
Scoop.it!

What Are The Biggest Online Learning Trends And Challenges?

What Are The Biggest Online Learning Trends And Challenges? | Create, Innovate & Evaluate in Higher Education | Scoop.it
Online learning takes many forms these days.
Alfredo Corell's insight:

Since learning online can take many different forms, it is interesting to look at some of the trends and challenges that moving from an in-person to a virtual environment can pose. The handy infographic below (from the awesome folks over at Education Dive), takes a gander at some of the trends in online learning (and a few fun statistics) and some of the challenges that online learning poses.

No comment yet.
Rescooped by Alfredo Corell from Transmedia: Storytelling for the Digital Age
Scoop.it!

SEVEN STEPS TO THE PERFECT STORY [Fun Infographic]

SEVEN STEPS TO THE PERFECT STORY [Fun Infographic] | Create, Innovate & Evaluate in Higher Education | Scoop.it

Via The Digital Rocking Chair
Alfredo Corell's insight:

A funny and easy way to build your own story or lecture...

Mary Westcott's curator insight, March 1, 2016 10:14 AM

Maybe a tad too complex for our young students, but still a nice way of understanding the foundations of storytelling!!

Marisa d's curator insight, March 11, 2016 12:22 AM

Maybe a tad too complex for our young students, but still a nice way of understanding the foundations of storytelling!!

Salena Argar's curator insight, May 17, 2017 6:31 AM
Seven steps to the perfect story is a great visual representation of how to build a story. This clearly explains the process of how students can construct their narrative and the types of characters they will use. I would definitely use this in my classroom to help students understand the process of creating a narrative.
Scooped by Alfredo Corell
Scoop.it!

The Past, Present, And Future Of Online Education - Edudemic

The Past, Present, And Future Of Online Education - Edudemic | Create, Innovate & Evaluate in Higher Education | Scoop.it
What's the past, present, and future of online education? Who are the big names to know? This visual guide will get you up to speed in no time.
No comment yet.
Rescooped by Alfredo Corell from Presentation Tools
Scoop.it!

Generate Professional Charts and Diagrams From Your Data with Vizalizer

Generate Professional Charts and Diagrams From Your Data with Vizalizer | Create, Innovate & Evaluate in Higher Education | Scoop.it


Via Robin Good
Alfredo Corell's insight:

Free access is only for 10 charts/month and withour pdf loading tool.

ratzelster's curator insight, June 27, 2013 9:09 AM

Here's another option I wanted to share with you.....telling our message is great.  Showing is great too.  Showing and telling is pure gold.  Vizalizer might be a way that makes the showing easier.

Check it out.

María Asunción Martínez Mayoral's curator insight, July 8, 2013 7:16 PM

Interesante perspectiva: "Data as knowledge. Users as influenzers"

Estelle Metayer's curator insight, January 5, 2014 4:00 AM

Great tool for outstanding end products

Scooped by Alfredo Corell
Scoop.it!

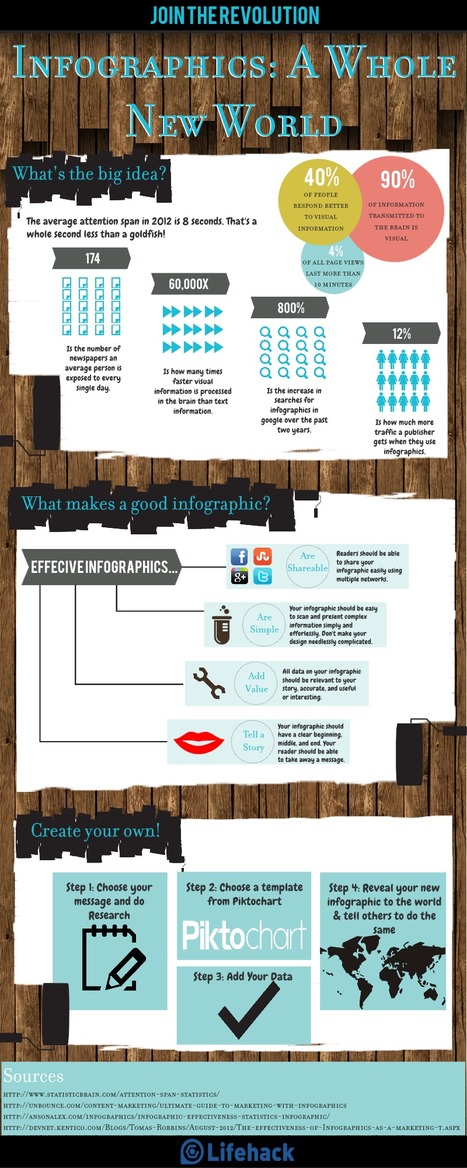
Making good infographics #infographic #design

Making good infographics #infographic #design | Create, Innovate & Evaluate in Higher Education | Scoop.it
Hola: Una infografía sobre: Haciendo buenas infografías. Un saludo
Alfredo Corell's insight:

Good tips to make and design your own infographics

No comment yet.
Scooped by Alfredo Corell
Scoop.it!

10 consejos para el uso de las TICs en clase

10 consejos para el uso de las TICs en clase | Create, Innovate & Evaluate in Higher Education | Scoop.it
10 consejos para el uso de las TIC en clase. #tic #consejos #clases #infografia #infografía #infografias #infograph #graph #graphics #infographics
No comment yet.
Suggested by Kenneth Mikkelsen
Scoop.it!

Future of Higher Education

Future of Higher Education | Create, Innovate & Evaluate in Higher Education | Scoop.it

This great Infographic explores the future of higher education. 

Alfredo Corell's insight:

Things that gonna happen in less than 1 year... in a couple or perhaps in a bit longer time. And universities... working on that

No comment yet.
Rescooped by Alfredo Corell from 21st Century Tools for Teaching-People and Learners
Scoop.it!

Great Pinterest Tips for Students

Great Pinterest Tips for Students | Create, Innovate & Evaluate in Higher Education | Scoop.it

Pinterest is a promising visual bookmarking platform. It is gaining in popularity more and more and of course teachers and educators are part of this success for there are now a burgeoning number of  educational boards on Pinterest where you can get free access to tons of web tools and teaching tips.There are also some great educational Pinners that are  committed to sharing useful resources with their fellow teachers. In this regard, Educational Technology and Mobile Learning has its own Pinterest Board where we have been pinning everything we publish here or we find in other blogs and websites, make sure to follow us to stay updated about our future pinnings.


Via Andrea Zeitz, Les Howard, Lynnette Van Dyke, Gust MEES
Alfredo Corell's insight:

A must read!!!

Louise Robinson-Lay's curator insight, May 15, 2013 5:07 PM

Some great ways to use Pinterest.

Yahya Qachach's curator insight, May 18, 2013 5:53 AM

websocialmedianetworks

Yahya Qachach's curator insight, May 18, 2013 5:55 AM

websocialmedianetworks

Rescooped by Alfredo Corell from 21st Century Tools for Teaching-People and Learners
Scoop.it!

How to Create an Interactive Infographic With a Presentation

How to Create an Interactive Infographic With a Presentation | Create, Innovate & Evaluate in Higher Education | Scoop.it
There's no denying infographics are great to communicate data in an engaging, easy to understand way.

Via Baiba Svenca, EiriniKaragiorgaki, Informatics, Gust MEES
Alfredo Corell's insight:

Very interesting and easy to follow...


Gust MEES's curator insight, January 7, 2013 9:15 AM

Very interesting and easy to follow...


Adriana Favieri's curator insight, January 8, 2013 5:40 PM

Very interesting and easy to follow...


Rescooped by Alfredo Corell from Digital Presentations in Education
Scoop.it!

Creating infographics | screencast tutorial

You can create infographics - visual representations of data - from scratch using free web tools. Library consultant and educator Linda W. Braun takes you step by…


Via Baiba Svenca
Alfredo Corell's insight:

Very good and detailed tutorial for creating infographics

Baiba Svenca's curator insight, December 29, 2012 2:43 AM

Great detailed tutorial on how to create infographics using two popular tools - http://www.easel.ly/ and http://infogr.am.

Scooped by Alfredo Corell
Scoop.it!

Moodle está muriendo en favor de Edmodo? Todavía no...

Moodle está muriendo en favor de Edmodo? Todavía no... | Create, Innovate & Evaluate in Higher Education | Scoop.it
Alfredo Corell's insight:

De Basilé


¿Ha muerto Moodle o está muriendo? A mi modo de verlo... aún no. Sigue siendo libre y eso en estos tiempos (aunque sea menos bonito que Edmodo) seguirá pesando...

No comment yet.
Rescooped by Alfredo Corell from Digital Presentations in Education
Scoop.it!

How to Create Stunning Infographics in 30 Minutes or Less with Piktochart

How to Create Stunning Infographics in 30 Minutes or Less with Piktochart | Create, Innovate & Evaluate in Higher Education | Scoop.it

Learn how to create stunning infographics - without spending hundreds of dollars on a graphic designer or losing your mind - in just 30 minutes or less.

From word clouds to network data visualizations, infographics have become a primary format for content in a relatively short period of time. Although the ‘infographic’ is nothing new, its proliferation and evolution has been nothing short of exponential in the past few years.

Whether you love them or hate them, the rising popularity of infographics can’t be denied.


The Piktochart site (free): http://piktochart.com/


Via Baiba Svenca
Jeff Domansky's curator insight, January 7, 2013 4:29 PM

Really excellent how-to using the impressive Piktochart infographic tool.

Neil Ferree's curator insight, February 26, 2013 10:05 AM

Infographics done right and done well can generate lots of traffic to your http://bit.ly/RichSnippet and build your brand

Charles-Louis Mazerolles's curator insight, March 8, 2013 3:28 AM

good tool to know :-)

Rescooped by Alfredo Corell from Pedalogica: educación y TIC
Scoop.it!

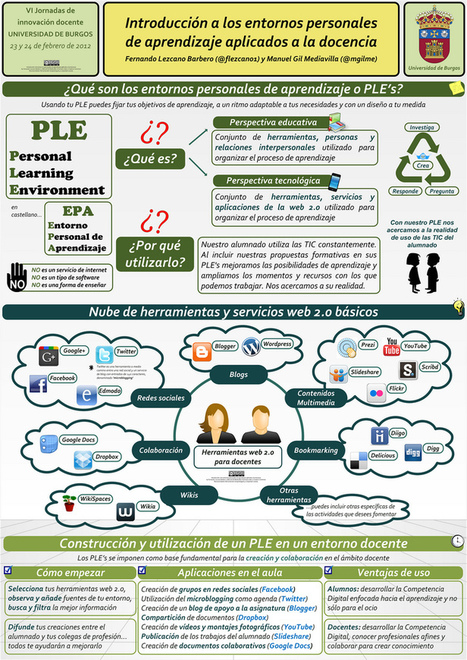
El proceso de enseñanza/aprendizaje con herramientas web 2.0. ¿Quién enseña a quién?

El proceso de enseñanza/aprendizaje con herramientas web 2.0. ¿Quién enseña a quién? | Create, Innovate & Evaluate in Higher Education | Scoop.it

Pongámonos en situación. El alumno/a levanta la mano y pregunta al profesor/a:

“¿Y si en vez de presentar el trabajo en clase creamos un blog y una wiki para que todos podamos participar y luego compartir lo que hagamos en Facebook y Twitter?”


Via Manuel Gil , Mª Jesús García S.M., Juergen Wagner, Marisa Conde, Alazne González
Txomin Bujanda Garate's curator insight, December 7, 2016 5:58 AM
proceso de enseñanza-aprendizaje con las nuevas tecnologías
Luz Andrea's curator insight, September 9, 2019 1:15 PM
Muy interesante saber esto que es lo basico
Maribel Aranda's curator insight, September 9, 2019 1:22 PM
Muy interesante esta informacion
Rescooped by Alfredo Corell from Digital Presentations in Education
Scoop.it!

Murally: Sketching on Sticky Notes

Murally: Sketching on Sticky Notes | Create, Innovate & Evaluate in Higher Education | Scoop.it

After many requests for a drawing feature, we’re happy to announce that Mural.ly now allows you to sketch your ideas out on sticky notes (and we’re pretty excited about it).


Via Baiba Svenca
Alfredo Corell's insight:

Mural.ly has novel tools. Among other, you can add sticky notes inside.


Have a go for your infographics

Rosemary Tyrrell, Ed.D.'s curator insight, July 8, 2014 12:27 PM

Presentation tool with a new feature. 

Raquel Oliveira's curator insight, July 8, 2014 6:20 PM

infografico do caminho de desenho de serviços que vale como refererencia.

Cynthia Day's curator insight, July 30, 2014 2:48 PM

sticky

Rescooped by Alfredo Corell from Digital Presentations in Education
Scoop.it!

27 Presentation Tips For Students And Teachers

27 Presentation Tips For Students And Teachers | Create, Innovate & Evaluate in Higher Education | Scoop.it
In an effort to help you become the next Steve Jobs of presenting, here are more than two dozen different presentation tips.

Via Baiba Svenca
Alfredo Corell's insight:

A simple and useful tips-guide (infographic) for your students to present.

Janell Marmon's comment, August 13, 2013 5:03 AM
A colleague shared a ppt yesterday from a professional organization that was a non-example. The importance to teaching and re-teaching this is essential.
BookChook's curator insight, October 9, 2013 11:44 PM

Great tips for kids and adults. 

Jazmin Reyes's curator insight, February 13, 2014 2:45 AM

Everyone is afraid of getting up on stage and giving a speech or what ever they need to do in front of an audience. These kind of tips are helpful in every way possible especially when someone is nervous. Knowing that we need to just breathe is an important thing. These skills can allow us to get better in our presentations.

Rescooped by Alfredo Corell from visualizing social media
Scoop.it!

A Detailed History Of Social Media - Infographic

A Detailed History Of Social Media - Infographic | Create, Innovate & Evaluate in Higher Education | Scoop.it

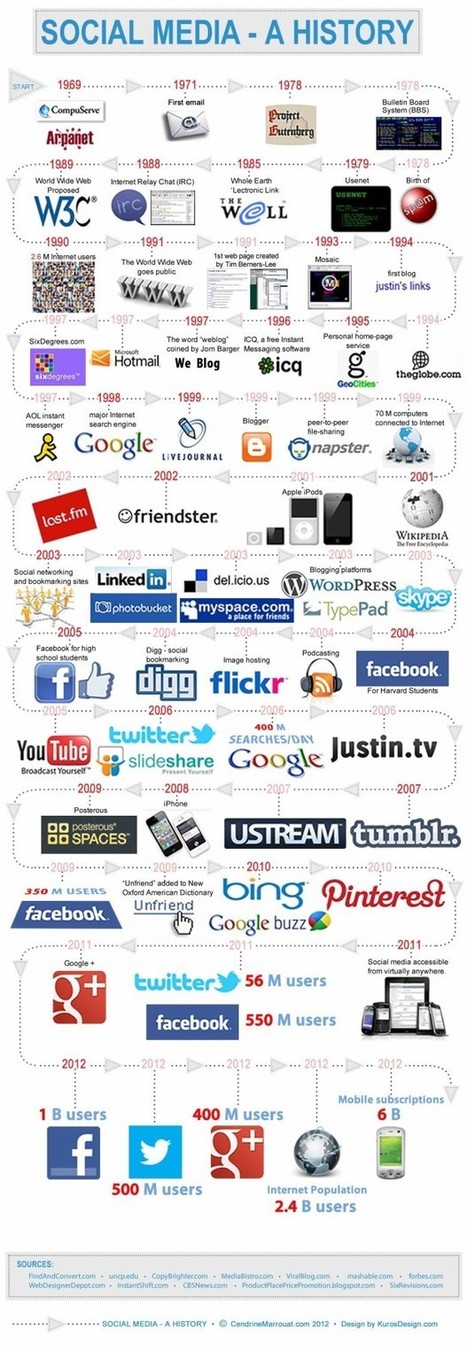
Do you know the history of social media? Think we'll remember Facebook in 20 years? This detailed timeline is a must-see.


Social media began decades before the Facebook era. It started, more or less, with CompuServe and Arpanet back in 1969. A couple years later, the first-ever email was sent.

It has evolved over the past few decades into a powerful tool, as seen in this social media history timeline. With so much that’s happened over the past few decades, we can only guess what’s coming next for social media.


Via Lauren Moss
Charles Rein's comment, July 24, 2013 3:38 PM
From the land of "Wired Telephones" USA, we can now look at how explosive Global growth and the potential 5-7 billion people who will always use a Smart or Cell device
Eleonora Guglielman's curator insight, August 1, 2013 9:18 AM

Nice infographic

lbligen's curator insight, August 4, 2013 5:44 AM

Always new background information.

Rescooped by Alfredo Corell from Digital Delights - Digital Tribes
Scoop.it!

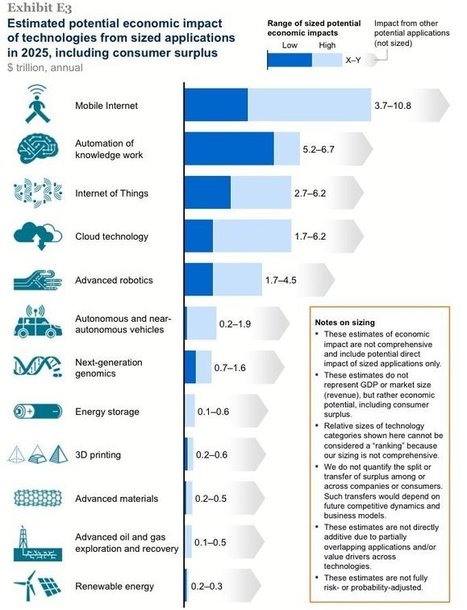
12 Disruptive Technologies That Are Changing The World

12 Disruptive Technologies That Are Changing The World | Create, Innovate & Evaluate in Higher Education | Scoop.it
A potential $33 trillion/year impact by 2025.

Via Ana Cristina Pratas
Alfredo Corell's insight:

Quizás sería esperable que las Renovables tuviesen más impacto en los próximos 12 años.

Linda Allen's curator insight, May 27, 2013 2:08 PM

Really amazing!

Martin (Marty) Smith's curator insight, May 28, 2013 2:46 PM

Like this graphic as it approaches the issue of disruption from a more macro view. 

Daniel Jimenez Zulic's curator insight, June 5, 2013 8:19 AM
Muy interesante, y me parece genial que aparezcan las energias renovables en el grafico, aunque a mi juicio el nivel de impacto seria deseable fuera mayor de aqui al 2025.
Rescooped by Alfredo Corell from 21st Century Learning and Teaching
Scoop.it!

Blended Learning & The Teaching Profession [Infographic]

Blended Learning & The Teaching Profession [Infographic] | Create, Innovate & Evaluate in Higher Education | Scoop.it
Just in time to bust a myth that reared its ugly head in the closing keynoteat the ASU/GSV Summit, Digital Learning Now! today released the "Blended Learning & The Teaching Profession."

Via Gust MEES
Jon Altuna's curator insight, April 21, 2013 7:40 AM

Thank you Alazne

AnnC's curator insight, April 21, 2013 11:55 AM

Improve conditions for teachers and students with better tools.

Scooped by Alfredo Corell
Scoop.it!

Create Interactive Presentations, Animations and infographics - HTML5 Presenter by Easy WebContent

Create Interactive Presentations, Animations and infographics - HTML5 Presenter by Easy WebContent | Create, Innovate & Evaluate in Higher Education | Scoop.it
Alfredo Corell's insight:

Not as easy as advertised. But deserves a visit

Payman Taei's comment, May 16, 2013 4:53 PM
Hi Alfredo. Thanks for your insight; Actually Presenter is currently free to the public. there is No paid extensions (You may have confused it with another product such as our Site Builder). Also since March 28th we've added over 24 new improvements and features with more refinements coming thanks to our user feedback.
Alfredo Corell's comment, May 18, 2013 2:42 PM
Sorry Payman. The "try it for free" all around the web page made me think of a "pro" paid version.
Rescooped by Alfredo Corell from Learning & Technology News
Scoop.it!

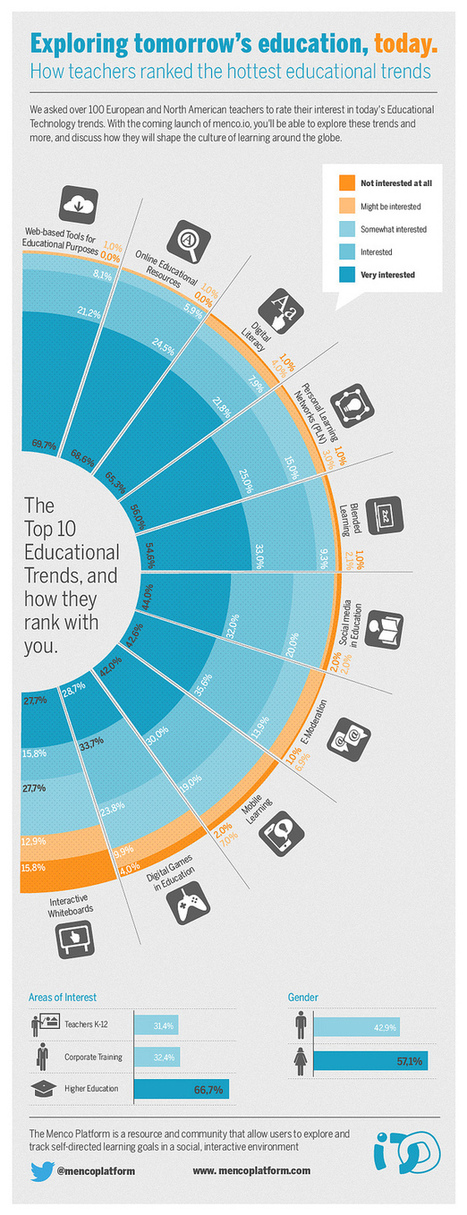
The Top 10 Educational Trends

The Top 10 Educational Trends | Create, Innovate & Evaluate in Higher Education | Scoop.it

Teachers rate their interest in today’s Educational Technology trends. With the coming launch of menco.io, you’ll be able to explore these trends and more, and discuss how they will shape the culture of learning around the globe.


Via Nik Peachey
Alfredo Corell's insight:

Interesting results... but at the moment only 100 teacher answer about trends... a bigger universe would give more valuable results

Ali Anani's curator insight, September 10, 2013 12:16 AM

Exploration of the changing teaching landscape

Alfredo Corell's comment, January 26, 2015 9:16 AM
well... Elena, you are speaking about a 2013 post!!!!
Sarah E Kerr's curator insight, June 2, 2016 4:35 AM
A fascinating snapshot of trends for ICT uses in teaching
Rescooped by Alfredo Corell from Into the Driver's Seat
Scoop.it!

20+ Tools to Create Your Own Infographics

20+ Tools to Create Your Own Infographics | Create, Innovate & Evaluate in Higher Education | Scoop.it


Via 173 Sud, Chrisange , Rose Marie DeSousa, massimo facchinetti, Becky Gaylord, John van den Brink, juandoming, olsen jay nelson, Jim Lerman
Alfredo Corell's insight:

While not everyone can make infographics from scratch, there are tools available on the Web that will help you create your very own infographics. In this article, they-re listing more than 20 such options to help you get your messages across to your readers, visually.


Some of them really simple. Most of them... visual. Try, gooo

Alessio Manca's comment December 31, 2012 4:00 AM
GR8 Collection! TYVM John!
Devrim Ozdemir, Ph. D.'s curator insight, January 9, 2013 8:39 AM

While not everyone can make infographics from scratch, there are tools available on the Web that will help you create your very own infographics. In this article, they-re listing more than 20 such options to help you get your messages across to your readers, visually.


Some of them really simple. Most of them... visual. Try, gooo

Rescooped by Alfredo Corell from educación líquida
Scoop.it!

Infografías: qué son y cómo crearlas | Aprendo en la web

Infografías: qué son y cómo crearlas | Aprendo en la web | Create, Innovate & Evaluate in Higher Education | Scoop.it

Via manuel area
Alfredo Corell's insight:

muy interesante el bucle (infografía explicando cómo hacer una)

manuel area's curator insight, December 31, 2012 8:27 AM

Una infografía explicando cómo hacer una infografía. Interesante y útil

Renata Rodrigues's curator insight, January 1, 2013 7:23 AM

Una infografía que explica cómo hacer una infografía

Scooped by Alfredo Corell
Scoop.it!

A Quick Guide To The History Of MOOCs - Edudemic

A Quick Guide To The History Of MOOCs - Edudemic | Create, Innovate & Evaluate in Higher Education | Scoop.it
So what is a MOOC? What's the history of MOOCs? How are they growing? What are some significant events in the world of MOOCs?
Alfredo Corell's insight:

By Jeff Dunn


With a public four year in-state degree costing $89,044 on average it’s easy to see why anyone would be looking for alternatives. MOOCs, Massive Open Online Courses, may be the solution. Since the first MOOC in 2008, this phenomenon has been spreading amongst very well accredited colleges. The movement has grown rapidly with over 100 courses already scheduled for 2013.

No comment yet.
Scooped by Alfredo Corell
Scoop.it!

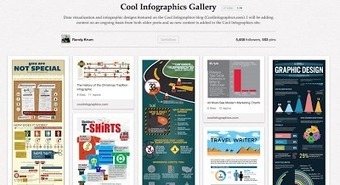
500+ Cool Infographics and their applications for Education

500+ Cool Infographics and their applications for Education | Create, Innovate & Evaluate in Higher Education | Scoop.it

Bu Richard Byrne


Earlier today I was on Randy Krum's Cool Infographics blog. Cool Infographics always has neat infographics and commentary about what makes an effective infographic. As I was browsing the blog I noticed that Randy Krum now has a substantial collection of infographics pinned on Pinterest. The Cool Infographics Pinterest page has more than 500 infographics pinned to it.

No comment yet.
Rescooped by Alfredo Corell from Pedalogica: educación y TIC
Scoop.it!

How Much Will Technology Change Higher Education? [Infographic] |

How Much Will Technology Change Higher Education? [Infographic] | | Create, Innovate & Evaluate in Higher Education | Scoop.it

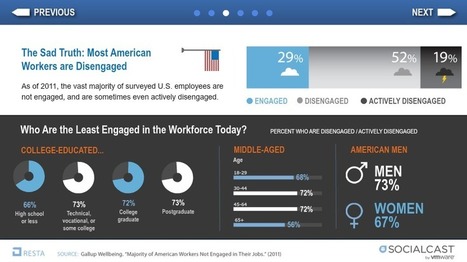
The infographic reports that most Americans are not currently pleased with the value of higher education: 57 percent of U.S. adults said that the higher education system fails to provide students with good value for their money. If changes are needed, how much can we expect will change by 2020? The infographic reports that 39 percent of those surveyed believe only modest changes will occur in higher education (defined below in the infographic), while 60 percent believe that substantial change will occur in the next eight years, and that higher education will look much different than it does today.


Via Alazne González
No comment yet.