


Instead of writing a syllabus or creating assessments or working on lessons plans, I have procrastinated and scoured some images from the web to make these. I have uploaded .png's of these into thi...
Get Started for FREE
Sign up with Facebook Sign up with X
I don't have a Facebook or a X account


 Your new post is loading...
 Your new post is loading...
Your new post is loading...
Instead of writing a syllabus or creating assessments or working on lessons plans, I have procrastinated and scoured some images from the web to make these. I have uploaded .png's of these into thi...
Beth Dichter's insight:
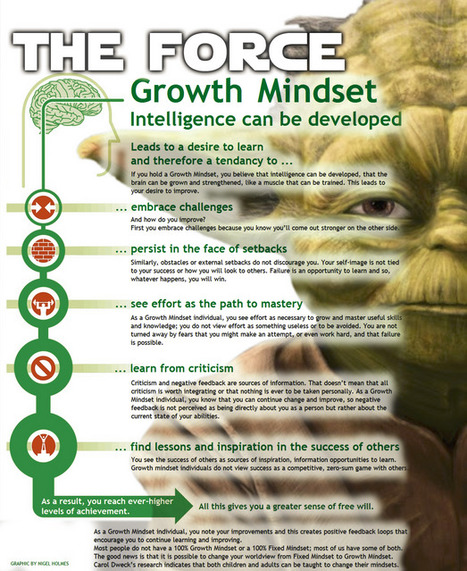
If your learners are fans of Star Wars, then these posters may find a place in your classroom. You will find not only the image above (which is on Growth Mindset), but also an image of The Dark Side, otherwise knows as a Fixed Mindset. In addition, there is a poster 8 Mathematical Processes of Jedi Masters, as well as one on Standards Based Gradings (an assessment tool). To go directly to a page that allows you to download the images click here. 
Professional infographic designers rely primarily on a core vector graphics software program to cr...
Beth Dichter's insight:
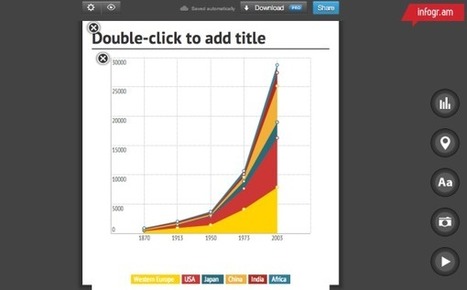
Here is an up-to-date review of five tools that allow you to create infographics. Each tool is described. There is a list of pros and cons for each tool. All have free versions available, and some have more robust versions that cost additional money. The five tools that are discussed are: * Visme * Canva * Easel.ly * Piktochart * Infogr.am Providing opportunities for students to create infographics allows them to create graphs, use a different style of writing, and have some fun while showing that they understand key concepts and ideas.

Given we’ll shortly be reaching the centenary of the outbreak of World War One, we compiled this piece to explain the key global events of the...
Beth Dichter's insight:
If you teach history/social studies this post is right up your alley. The website MadeFromHistory has put together 30 infographics that look at 30 key events in the last 100 years, and they do acknowledge that the have "left out quite a few events" due to space limitations. You can also find sections that focus on World War I, World War II, and Civil Rights as well as a Referenced Blog, which shares a wide variety of topics. For many students, using visuals helps them to recall information more readily. If you teach history from the past 100 years it is worth checking out this website.

David Baker's curator insight,
July 29, 2014 12:04 PM
Visuals that include original source materials make classroom experiences much more relevant to students. It allows the story of the events to be made more real whether it is the experiences of WWI, WW II, or Civil Rights.

Anne-Maree Johnson's curator insight,
July 29, 2014 6:44 PM
valuable tool for teaching of history. A series of infographics, timelines and a referenced blog which give valuable visual insight into key events from the last century.

We all know that when it comes to consuming content, text alone no longer makes the cut. We are multi-sensory beings and the more we can plug into our senses to
Beth Dichter's insight:
Who better than Visual.ly to share 7 online tools that will help you create visual, be they simple images, infographics or a mind map. This post shares the following tools: * Canva - a free tool * Pixlr - a free tool * PicMonkey - a free tool, but you may pay for additional tools * Quozio - free tool * Share As Image - a free tool, but will show a watermark; pay for no watermark * Skitch - free through Evernote * Coggle - free tool that allows you to create mind maps Visuals are a key part of learning. These seven tools provide a range of options that you may want to use when designing materials for your classes (or perhaps students would find use for them in your class).
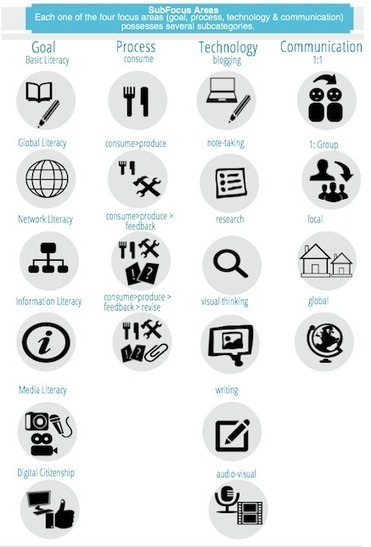
"My colleague, Silvana Meneghini, and I have been working on developing a Professional Development framework for embedding technology use and modern learning litercies based on Ruben Puentedura's SAMR model. The template consists of 4 Focus Areas. Each stage of the SAMR model consists of 4 focus areas in the template, that support vision, planning, and evaluation in activity and task design as well as a professional development framework."
Beth Dichter's insight:
If you are considering using the SAMR model to design lesson plans/units you should consider checking out this post. There is a very detailed template that helps you walk through the steps and consider how to best design your lesson/unit. The template is detailed and you may download it as a pdf. An example is included. Many are turning to the SAMR model as a guide to integrate technology into their curriculum. If this model is new to you search this Scoop.it or type SAMR in your favorite search engine and you will find a wide variety of resources.
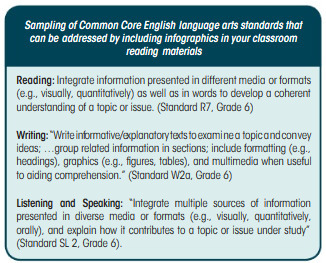
Infographics are modern, written artifacts about collected resources in a dynamic, visual format. Infographics should be viewed as complex, standalone texts, not simply a text feature or graphic element.
Beth Dichter's insight:
This paper looks at digital literacy, specifically how infographics can be used to meet Common Core standards. A well designed infographic will have: * A Purpose * A Style * Evidence * Format The paper also includes a section "How can I teach comprehension with infographics?" This section includes two infographics and has the students critique them using the following questions: * What is the author's purpose or question? * What evidence supports the author's claim? * What are the strongest elements of this design? * How could the design be improved? You could use these same questions and have students in your class critique their infographic and their classmates. And last but by no means least they provide a list of locations where you can create an infographic. Infographics support reading comprehension and writing skills. They also allow students to strengthen their critical thinking skills and synthesis skills.

niftyjock's curator insight,
January 19, 2014 7:12 PM
I often get very bored with infographics, but these techniques will help me not only read them better but have a go at c reating my own 
Greenwich Connect's curator insight,
January 20, 2014 7:28 AM
Slightly overblown tone, presumably to help what is a useful overview of infographics sound more "academic" - read between the lines for what students should think through and how they should approach their own infographic production 
Kerri Schaub's curator insight,
January 20, 2014 8:10 AM
Visualizing is a powerful multisensory technique.
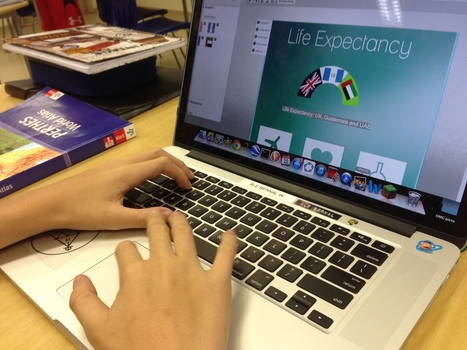
7th grade Geography teacher, David J. at Graded-The American School of Sao Paulo, was planning an in-depth country data study and interpretation. He decided to allow his students to explore the use...
Beth Dichter's insight:
Take a look at this post to see one way to use infographics to help teach critical thinking. The post provides a look at what makes a good infographic as well as two suggestions for free tools to help students create them. There are also a couple of videos that will help students learn more about infographics as well as the need to cite sources, samples of infographics made by the students and more! Think about finding a topic that your students could research and consider having them make infographics to show their understanding...chances are they will be engaged in the process.
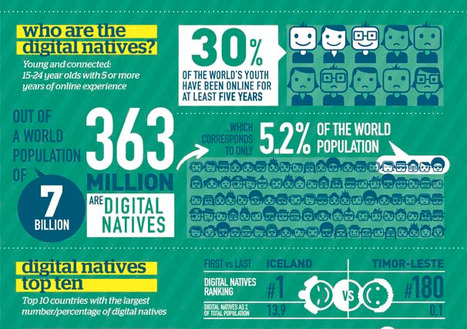
At first, I figured that the results of this study would be pretty obvious. First world countries with large populations and higher birth rates would be at the top of the list.
Beth Dichter's insight:
What do you think? Do you believe the results are obvious? If so, you may be surprised. Learn about the "digital natives" in the following areas: * Who they are * The top ten countries by percentage * The young and connected * Future trends This infographic could be used to begin a discussion with students by asking what they think? What is the age range for a digital native? Which countries have the most digital natives? What does it mean to be young and connected? What do they think the future holds?

Mary Cunningham's curator insight,
October 26, 2013 12:27 PM
What do you know about digital natives?
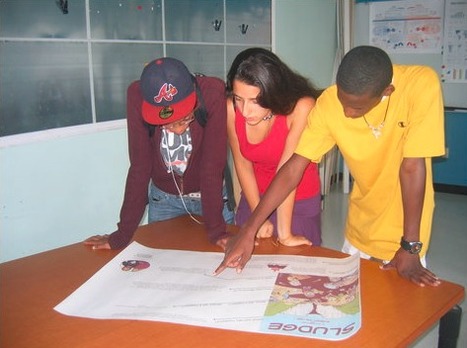
In our final post of Infographics Week, a history teacher tells how she used the Gulf oil spill to have students create infographics about the worst disasters in American history.
Beth Dichter's insight:
Have you thought about having students create infographics and held back because you were not sure how to go about doing this type of project? This post provides an in-depth look at one teacher does this type of project. A step-by-step list of what to do is included as well as the three essential questions that students were to address. Although designed for a high school class the step-by-step directions are easy to modify to meet the needs of your students. This was one of a series of posts published by the NY Times. At the end of the post there are links to four additional posts in this series on Teaching With Infographics: Places to Start; Social Studies, History, Economics; Science and Health; and Language Arts, Fine Arts, and Entertainment.

Nalya Ovshieva's curator insight,
September 29, 2013 3:14 AM
Infographics is a new kind of visual literacy. They are a kind of visual summary of information that would take a reader hours to process
David Baker's curator insight,
September 29, 2013 6:40 PM
This was a great project for our teachers last year. We are posting their info graphics outside out Office of Professional Development. 
Gayle Kakac's curator insight,
September 30, 2013 8:10 PM
Been loving infographics and looking for a good way to incorporate these. Hoping for an app that would make them easily. We'll see what this has to say...
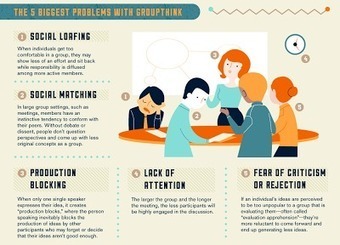
"Brainstorming, for example, which has been practiced for decades in every boardroom and classroom across America, has been shown almost never to work. Brainstorming relies on the conceit that any idea is a good idea, and that feedback is the same as criticism which kills spontaneity. Both of these notions are completely false, and taken as the underpinnings of creativity, they yield surprisingly few and alarmingly thin suggestions in response to any group-think exercise."
Beth Dichter's insight:
So does brainstorming work? Check out the 2 minute video that looks at this issue (embedded in the post) as well as many other great resources including: * An infographic "Move Beyond Brainstorming" that provides suggestions for more effective group work and discusses the concept of "lateral thinking". * A second infographic "Are We Brainstorming the Wrong Way?" that looks at ways to generate ideas through interpersonal learning. * And one final infographic from Mindjet 'Between Minds" that provides "an ongoing taxonomy of team dynamics" by comparing the left brain and right brain.

Jackie Keith's curator insight,
June 18, 2013 10:26 AM
The SCAMPER technique can help. http://www.brainstorming.co.uk/tutorials/scampertutorial.html
Beth Dichter's insight:
A collection of infographics and interactives that the NY Times published during 2012. Learn more about the Olympics, the 512 Paths to the White House, Hurricane Sandy’s Destruction in NY City and the region, Watching Syria’s War, 117 Years of Drought in theUSand more. Each one also provides a back story as well as information on how they were created.

A look at what infographics are, beginning with definitions from three locations as well as one great infographic that provides a short but great definition (and uses lego block)! Additional examples of infographics are provided (including a short vidoe that describes them) as well as the science behind infographics and infographics and education. A list of additional resources is also listed.
Larry Ferlazzo provides "a short and simple list of multimedia resources that would be useful for introducing students to the value of charts, graphs and infographics and what they mean."
|
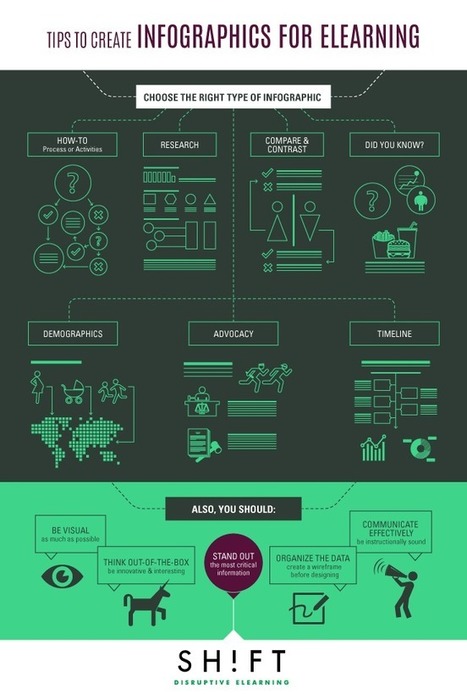
"But before you blindly jump on the infographics bandwagon and splatter your course with these visuals, make sure that you stock up on information about how they work and when to use them. Badly-designed infographics or placing them out of context can increase the cognitive load of a course. So here's the lowdown on infographics."
Beth Dichter's insight:
Infographics seem to be everywhere today, and educators are taking note and using them with students. This post provides information on the use of infographics for elearning, but the same concepts apply to face2face learning. The post is divided three sections that include: * When to use infographics * When NOT to use infographics * 6 tips to create effective and stunning infographics Additional resources are included in the post. If you are designing or revising a course and have not made use of infographics that post may provide you with ideas on how to best incorporate this form of visual learning into your curriculum. And if you currently use infographics check it out to learn more.

jane fullerton's curator insight,
March 29, 2015 10:26 AM
Awesome resource for a quick how to tutorial on infographics!
Beth Dichter's insight:
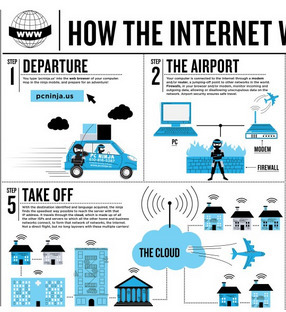
Do you understand how the Internet works? Can you dissect a URL? How much does a terabyte hold? These questions (and several others) are answered in a number of infographics created by Abby Ryan Design and available at this website. If you teach students about these concepts this may help many visual learners in their understanding. The infographics found here are: * Dissecting a URL * How the Internet Works * The Evolution of Computers * How much does a TB Hold? * 7 Commandments of Computer Use * 10 Signs Your Computer has a Virus * Anatomy of a Ninja Have fun exploring and sharing these with your students.
"Infographics are a visually stunning way to deliver facts and statistics to readers. They have become incredibly popular recently on Pinterest, Twitter, and lots of other social media tools because users are looking for a quick way to get reliable information. Great infographics answer questions that people are interested in answering."
Beth Dichter's insight:
Have you considered having your students create infographics as a way to demonstrate their understanding of a topic? The creation of an infograhic requires that students research a question and analyze the information so the can create a visual presentation. In this post Kerry Gallager shares the process she uses with her students. The shorthand version is below but check out the post for more information as well as some student responses to the project. * Begin with an essential question * Provide access to information and data * Teach the students what makes a great infographic * Choose a number of infographic creation tools and let the students use the one that works best for them * Remember, you are the facilitator * Make sure the students are provided time to finish, polish and publish (which may be done at home if students have access to computers) * Have students reflect on their work
"This past week I taught a few classes on infographics and decided to update the page by adding a section called "Teaching With Infographics". It is important for your students to make sure that they evaluate any infographics they are using, by making sure the author/creator has cited their references. Misinformation on the web exists. Have students read these tips to make a better infographic."
Beth Dichter's insight:
The Media Specialist has recently updated her information on teaching with infographics. This post provides many great resources including a post on tips to make better infographics, an in-depth video on teaching with infographics, a series of videos that detail how to use Piktochart to create infographics, and many other resources. If you are considering having students create infographics check out this post for resources.

The Rice Process's curator insight,
February 9, 2014 10:35 AM
Very helpful and great tips to follow. 
Claudia Estrada's curator insight,
February 23, 2014 2:56 PM
Working with info graphics has become an important skill now a days because new generation reads better images with less text. Helping students to become good users of it is developing 21st. century learners.
This past weekend, my step-daughter Emily, who works in the field of non-profit fundraising, asked me out of the blue, "Do you you ever teach your students about infographics?" I beamed with pride as I showed off my students' hard work.
Beth Dichter's insight:
In this post learn how a teacher took a project where students created an infographic on a non-fiction book and took it from being a "nice digital poster" and observed students whom had finished early poll their classmates and create infographics that included their new results. To quote from the post "These students had made a leap of understanding I hadn’t asked for: the images on an infographic were meant to convey data and information with the powerful impact of visual design." Read the post to learn about the process that followed and how you might have your students create infographic in your classroom for an assessment.
The Rice Process's curator insight,
January 25, 2014 11:50 AM
Infographics can be an effective assesment across the board.
Infographics, when used correctly, appropriately, are powerful tools for conveying a lot of pertinent information plus they support visual learning and thinking. I curate a Scoopit on Infographics...
Beth Dichter's insight:
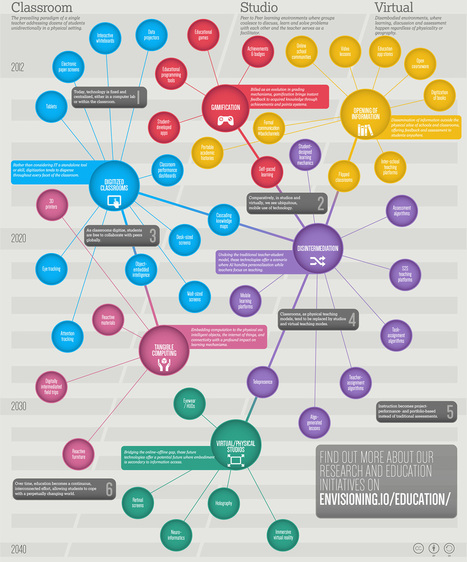
Jackie Gerstein shares her top picks for education infographics this year. Some of these have been shared in this Scoop.it but many are new. The list of infographics includes: * The Internet Access Gap in Education * The Past, Present and Future of Education * State of Creativity in Education: An Adobe Survey * The Gamification of Education * Tapping into Mobile Learning * Investing in Girls' Education Pays Off Many of these would be useful as topics for discussion or to use to teach students why infographics are useful in displaying data.

eclat's curator insight,
December 30, 2013 11:15 AM
Подтверждение того, что инфографика - должна быть важной составной частью обучения, в том числе в системе последипломного образования
This website helps college teachers develop, deliver, and assess assignments incorporating images, video, and sound.
Beth Dichter's insight:
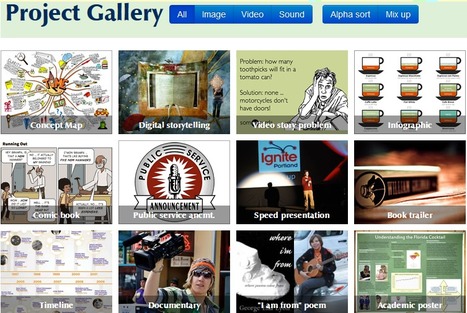
This website from the University Notre Dame provides great resources to help you embrace media-rich experiences for your students. The site currently has 24 projects which you may explore. Each project includes: * A brief explanation * Samples of projects * Resources to help you learn how to make the projects * Rubrics The projects listed include: video story project, infographics, academic poster, book trailer, geographic map and many more. Although this website was designed for college teachers the resources and ideas are useful for any teacher whom would to incorporate more media-based assignment in their classroom.

ech08ravo's curator insight,
December 1, 2013 10:50 PM
Fantastic website from Notre Dame helps instructors (and students) design effective media-based assignments. Great examples and how-tos for inspiration. 
Malin Fölster's curator insight,
December 7, 2013 8:37 AM
Wow denna sida var sååå bra. Jag förlorade mig själv på denna sidan idag! :)))
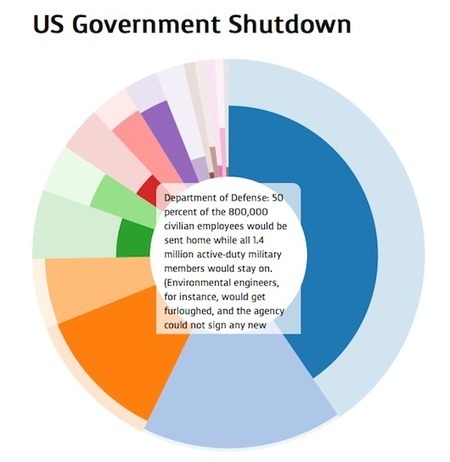
"The shutdown of the United States government began today. With no plan of action from either political party, there is consequently no easy lesson for teachers to share with their students."
Beth Dichter's insight:
Are your students asking questions about the shutdown of the US government? Are you looking for some excellent resources to help them understand what is going on? ASIDE has put together a number of resources to help you out. Check out this article where you will find * A short video from the BBC titled U.S. Government Shutdown in 60 Seconds * An interactive tool "US Government Shutdown" visualization (you may use your mouse and roll over different departments to learn the impact of the shutdown * An infographic "Who Goes to Work? Who Stays Home" from the NY Times * An infographic that asks "How Would a Government Shutdown Affect Your Life?" * A slide show from USA Today that catalogs the "Government Shutdown by the Numbers" and quite a few more. Many students are interested in this and this article notes that their questions were mostly on "blame and healthcare." You may find different questions in your classroom with this robust list of resources.

Nat Sones's curator insight,
October 2, 2013 8:13 AM
Shutdown is the ultimate failure of government. This seems not to have passed unnoticed exactly, but being missed as it gets covered in all sorts of other statements, facts, data and reactions. By shutting down, by neglecting their duty (not to mention wasting vast, unbelievable amounts of resource doing so), the US government has betrayed its people, and allowed political brinkmanship and the primitive desire to 'win the argument' to undermine the whole point of it.
If, that is, you believe that the point of government is to protect people, nurture civilisation and direct growth. If you believe that the point of government and the purpose behind politics is to further the careers and feed the egos of politicians, however, it's fine!
This material shows in crystal clarity how the shutdown is affecting US society and people. A good clear way of seeing the shocking neglect of duty that this represents - by all sides. Reaching consensus is the duty of politicians; not fighting to the death. Because the politicians never have to actually pay any price - others do that for them.
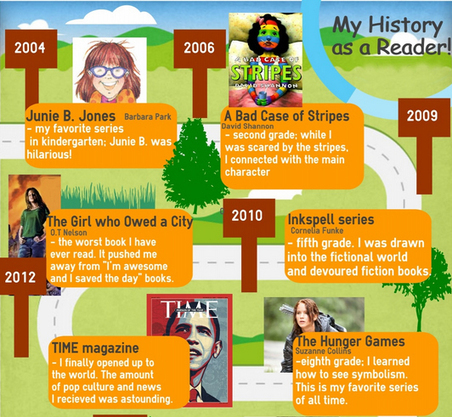
I'm an evangelist.
Beth Dichter's insight:
What would happen if you asked your students' to reflect on their reading history...and then have them create an infographic that helps them dig a bit deeper and share what they have learned? According to this teacher the finished product is pretty amazing! She began with an article from the NYTimes "What's Your Reading History? Reflecting on the Self as Reader". Then she had students explore infographics and critique them as a group. The students then explored a number of websites that allow you to create infographics (and links are provided to them) and students chose one to work with. The post provides links to a number of infographics made by the students. And the link to the article at the NYTimes is http://learning.blogs.nytimes.com/2010/03/04/whats-your-reading-history-reflecting-on-the-self-as-reader/?_r=0.
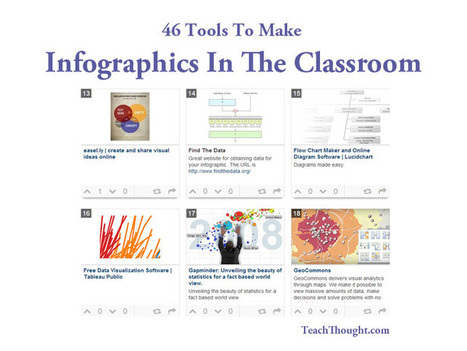
"Infographics are interesting–a mash of (hopefully) easily-consumed visuals (so, symbols, shapes, and images) and added relevant character-based data (so, numbers, words, and brief sentences). The learning application for them is clear, with many academic standards–including the Common Core standards–requiring teachers to use a variety of media forms, charts, and other data for both information reading as well as general fluency."
Beth Dichter's insight:
The use of infographics seems to be increasing and this post presents 46 tools that you may use to create an infographic, or better yet, have your students create an infographic. The tools are arranged alphabetically with a link to each as well as a short description. Some have costs involved but others are open source and freely available.

Donna Browne's curator insight,
May 8, 2013 2:23 PM
A list and links to the ever increasing number of tools that we can use to create infographics.

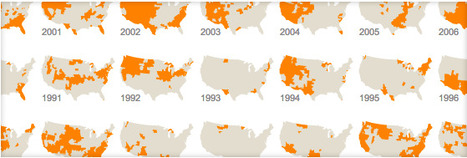
"2012 has been a great year for all kinds of data visualizations. Data owners are realizing that the best way to communicate the insights buried in their data is by visualizing it. This means there have been tons of great static infographics, motion graphics, and interactive visualizations created this year. We did a roundup of some of the best from each category."
Beth Dichter's insight:
Are you looking for some great infographics/visualizations? If so, check out this post from Visual.ly that provides 20 great infographics of 2012, 20 great motion graphics of 2012 and 20 great interactive visualizations of 2012. Infographics and visualizations are great tools to use with students. Here is a list of a few of what you may find when you click through to the post: Curiosity's Landing on Mars (The Seven Minutes of Terror), a map of Hurricanes since 1851, Measuring the Universe, and the History of Manifest Destiny.
Are you interested in seeing some infographics created by students using the tool Easel.ly. This post not only share some infographics created by 4th and 8th grade students using Easel.ly it also explains the parameters that were set as well as hte goal. Students were able to learn to use Easel.ly in one period, and the "only instruction given to each class was a sample infographic of what needed to be included." Additional links to other resources is also provided, including a link to a page that includes additional tools you might use to create infographics as well as links to a wide range of infographics based on subject.
|


If your learners are fans of Star Wars, then these posters may find a place in your classroom. You will find not only the image above (which is on Growth Mindset), but also an image of The Dark Side, otherwise knows as a Fixed Mindset.
In addition, there is a poster 8 Mathematical Processes of Jedi Masters, as well as one on Standards Based Gradings (an assessment tool). To go directly to a page that allows you to download the images click here.