


Common Core State Standards are calling for more focus on students reading charts and graphics, but new research shows engaging graphics can reduce students' understanding of chart data.
Get Started for FREE
Sign up with Facebook Sign up with X
I don't have a Facebook or a X account


 Your new post is loading...
 Your new post is loading...
Your new post is loading...
Common Core State Standards are calling for more focus on students reading charts and graphics, but new research shows engaging graphics can reduce students' understanding of chart data. 
No comment yet.
Sign up to comment

Free math help, tutorials, lessons, online solvers and calculators, metric conversions, solved math problems (step-by-step), integrals table, calculator and more.
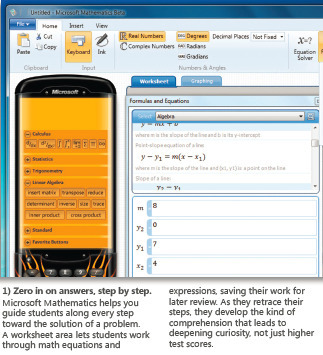
Microsoft Mathematics provides a graphing calculator that plots in 2D and 3D, step-by-step equation solving, and useful tools to help students with math and science studies.
|
From
visual

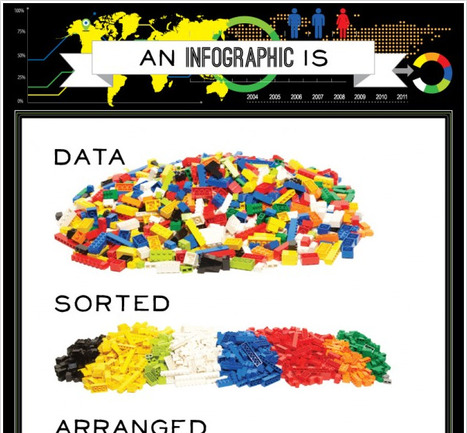
"This is an infographic about what is an infographic. Using Lego blocks and photography we wanted to show that.a good infographic is simple and require and requires little text."
Beth Dichter's insight:
This infographic is great for showing how basic an infographic may be, and to help students understand what goes into creating a graph. The four key concepts, collecting data, sorting data, arranging data and presenting the data visually (so others may understand it) are true when students learn how to make graphs...and most students have played with Legos at some point so there is a quick connection. To see the full infographic click through to Visual.ly.
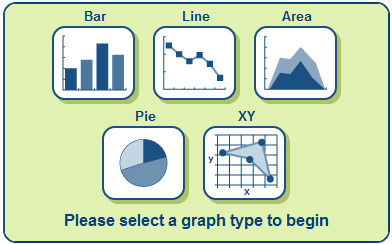
Graphs and charts are great because they communicate information visually. For this reason, graphs are often used in newspapers, magazines and businesses around the world.
|


"The common core calls for students to comprehend and connect information from visual elements, including charts, maps, and multimedia, in addition to understanding stories and informational texts." One question that comes up is how do we best teach students how to create and read graphs. This article presents information that "visually appealing graphics" may not be the best way for students to learn. By "visually appealing" they are describing graphs that use symbols, as in stacks of fruits or shoes, to represent the numbers as opposed to a bar graph.
Additional detail is provided in the article. Do you teach graphing to students in early elementary school? Reading this post may lead you to change your teaching methods (relative to graphing).